EXAMPLES

The follwing input

Interval   a:      b:
Function  f(x):  
No. of series' terms  m :      No. of integration nodes  n: 
gives the following graph:

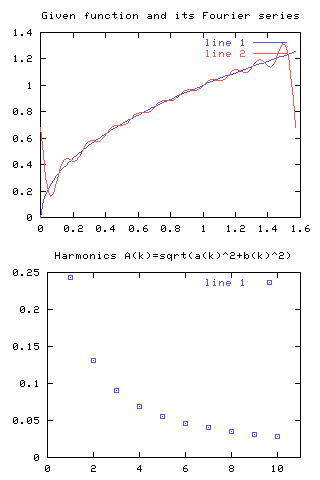
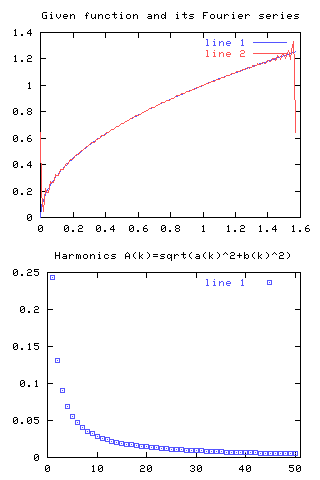
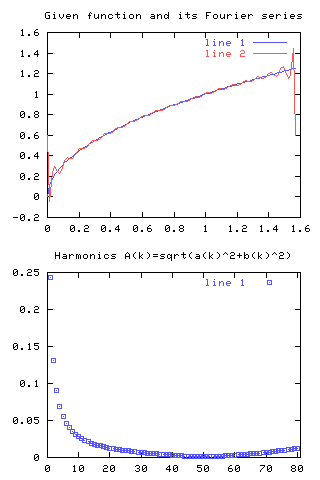
By increasing the number of terms, the approximation becomes better. The Gibbs' effect at the borders of the interval is also clearly seen:
Interval   a:      b:
Function  f(x):  
No. of series' terms  m :      No. of integration nodes  n: 


When the number of required terms of the series m becomes too large with respect to the number of integration nodes n, the approximation becomes less accurate and the harmonics start to grow:
Interval   a:      b:
Function  f(x):  
No. of series' terms  m :      No. of integration nodes  n: 


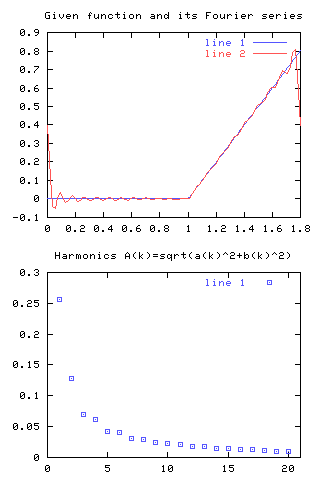
Piecewise defined function can be defined in the following way:
Interval   a:      b:
Function  f(x):  
No. of series' terms  m :      No. of integration nodes  n: